Skip Sub Menu
Results of Outcomes and Expectations for Initial Teacher Education at Drake University School of Education
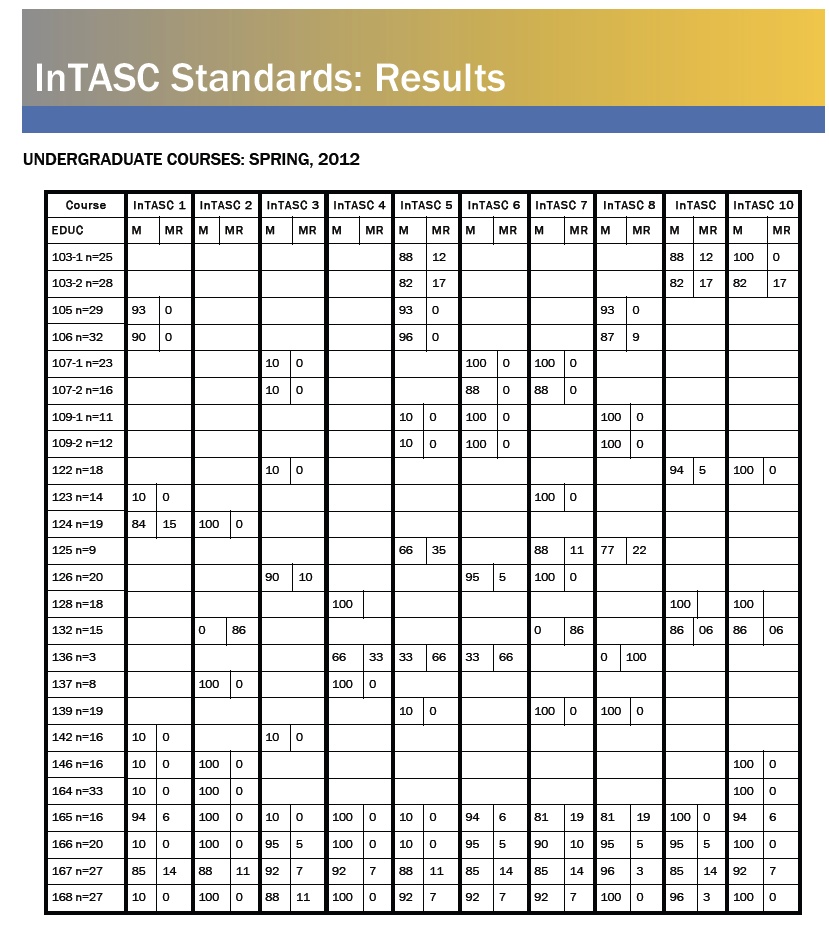
Assessing educational outcomes at the Drake University School of Education uses both direct and indirect measures to offer different perspectives on students’ growth and readiness to teach. Because knowledge and skills related to InTASC Standards in the Teacher Education Program link directly to target assignments and an exit ePortfolio, it is possible to assess those assignments and summarize the success of teaching candidates as they meet the standards, meet the standards with remediation, or do not meet the standards throughout the program. In order to meet the standard, a teaching candidate must attain at least an 80% on a target assignment. If a student scores below an 80% on a target assignment, he/she must redo the target assignment. The success rate of outcomes previously identified by course and level is expressed in percentages by semester for met and met with remediation as seen in the table below. Course reports that support this table in the Drake University School of Education LiveText Assessment System can be drilled down to student. Scores are also reported in students’ accounts so that reports by student are possible at each program gate: acceptance to the Teacher Education Program, acceptance for student teaching, and certification. These results reflect data from the latest complete semester, spring 2012.
Results of InTASC Standards for Undergraduate Courses - Spring, 2012
(M=Met, MR=Met with Remediation, Scores = Percentages)
 Scores by course are also available for graduate sections in the Drake School of Education Exhibit Center in the LiveText Assessment System.
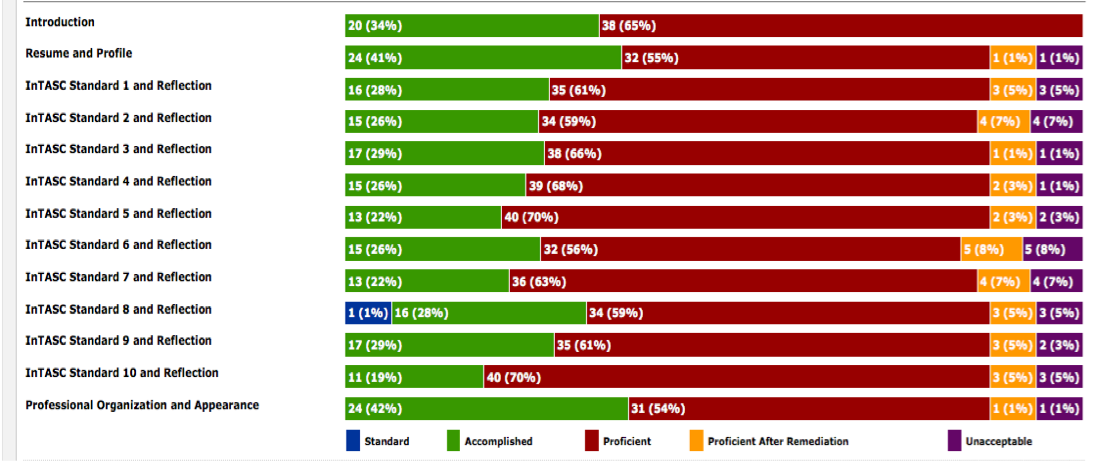
Results of ePortfolio Assessment
Results of the ePortfolio assessment from this same period also provide an overview of students’ successful demonstration of InTASC Standards from at the end of their programs. A sample of ePortfolio assessment for spring 2012 for undergraduates appears in the following chart. The purple indicates unacceptable initial submissions, but the gold indicates proficient after remediation, red indicate a proficient level, and green reports an accomplished level. Students have one chance to remediate an area of the portfolio that is assessed as unacceptable. No student is certified until all areas are deemed proficient.
Results of Disposition Assessment
Because dispositions are part of effective teaching practice, They must be addressed in multiple ways and at multiple levels in a looping manner: through academic work, the manner in which teacher candidates interact with colleagues and students in the field, and reflective practice about content knowledge, pedagogical skill, and professional relationships. This method creates data-driven feedback loops that lead to measurable success in establishing cultural proficiency while at the same time supporting assessment of those dispositions within accreditation mandates. Four years of data have resulted in strong feedback loops for teacher candidates in the program, but also for the program itself. In the tables below, results for individual items have been averaged within their categories in order to report a profile across years and levels.
Students' Self-Reflection in Foundations Courses
(Aggregated Mean Data in a Likert Scale of 1-4 with 1=Strongly Disagree, 2=Disagree, 3=Agree, 4=Strongly Agree)
|
Criteria for Drake SOE Dispositions |
F2008 |
S2009 |
F2009 |
S2010 |
F2010 |
S2011 |
F2011 |
S2012 |
| Completing assignments, tasks, and requirements on time |
3.61 |
3.72 |
3.54 |
3.64 |
3.55 |
3.61 |
3.59 |
3.74 |
| Using references and resources ethically |
3.54 |
3.73 |
3.58 |
3.65 |
3.66 |
3.67 |
3.84 |
3.75 |
| Acting respectfully toward others |
3.81 |
3.88 |
3.61 |
3.71 |
3.74 |
3.84 |
3.88 |
3.79 |
| Using appropriate professional language in discussions and writing |
3.70 |
3.63 |
3.72 |
3.64 |
3.63 |
3.71 |
3.66 |
3.52 |
| Maintaining a positive attitude toward students, peers, educators, and caregivers |
3.65 |
3.63 |
3.72 |
3.43 |
3.58 |
3.76 |
3.59 |
3.64 |
| Following established policies and procedures |
3.75 |
3.75 |
3.74 |
3.65 |
3.75 |
3.71 |
3.79 |
3.80 |
| Expressing a positive view of self |
3.60 |
3.00 |
3.46 |
3.36 |
3.40 |
3.39 |
3.59 |
3.61 |
Practicum Teachers Assessments in Foundations and Human Development Courses
(Aggregated Mean Data in a Likert Scale of 1-4 with 1=Strongly Disagree, 2=Disagree, 3=Agree, 4=Strongly Agree)
|
Criteria for Dispositions |
F2008 |
S2009 |
F2009 |
S2010 |
F2010 |
S2011 |
F2011 |
S=2012 |
| Completing assignments, tasks, and requirements on time |
3.76 |
3.75 |
3.66 |
3.57 |
3.69 |
3.75 |
3.82 |
3.78 |
| Using references and resources ethically |
3.92 |
3.89 |
3.90 |
3.90 |
3.94 |
3.86 |
3.89 |
3.86 |
| Acting respectfully toward others |
3.95 |
3.90 |
3.90 |
3.87 |
3.92 |
3.88 |
3.92 |
3.88 |
| Using appropriate professional language in discussions and writing |
3.90 |
3.90 |
3.86 |
3.84 |
3.90 |
3.82 |
3.86 |
3.91 |
| Maintaining a positive attitude toward students, peers, educators and caregivers |
3.90 |
3.90 |
3.91 |
3.86 |
3.91 |
3.85 |
3.89 |
3.85 |
| Following established policies and procedures |
3.86 |
3.89 |
3.90 |
3.90 |
3.94 |
3.86 |
3.89 |
3.86 |
| Expressing a positive view of self |
3.91 |
3.90 |
3.84 |
3.79 |
3.89 |
3.85 |
3.87 |
3.79 |
Data for all levels by semester are available in the Drake School of Education Exhibit Center in the LiveText Assessment System. Other direct measure of success can be found in the following statistics:
- Retention level for 2008-2012 = 85%
- Graduation Rate in 4 years for 2008-2012 = 91%
- GPA for student teachers, spring 2012
| Program |
Average GPA |
| Elementary Education (n=16) |
3.55 |
| Secondary Education (n=27) |
3.52 |
| Graduate Elementary Education (n=5) |
3.96 |
| Graduate Secondary Education (n=17) |
3.83 |
| All Programs (n=65) |
3.64 |
Praxis 1 Scores (2011-2012)
| Category |
Cut Score |
Average Score |
Students |
Percentage Passed on First Try |
| Reading |
171 |
180.77 |
136 |
97.5% |
| Writing |
171 |
177.69 |
136 |
97.7% |
| Math |
169 |
181.82 |
136 |
100% |
Praxis II Scores (2011-2012) Elementary Education
| Test |
Cut Score |
Average Score |
Students |
Percentage Passed on First Try |
| 0011 |
151 |
178.32 |
25 |
100% |
| 0014 |
142 |
162.00 |
10 |
100% |
SOE News
