Stories matter and numbers help us tell our story. The numbers below help us understand who we are and help us capture pinpoints in the life of our community. The numbers also give us direction – we are able to identify successes on which to build and opportunities for improvement.
Who is Drake University?
The Bulldog family is made of students, faculty, and staff. These statistics cannot tell the whole story of our vibrant and unique family, but they provide an overview of who’s a Bulldog and proud of it.
A Global University
The Drake campus is home to students from around to globe and welcomes international students from several countries. Check out the resources that Drake has curated just for its international Bulldogs.
143
International Students
43
Countries Represented
Undergraduate Graduation Rates
In 2013 and beyond several retention initiatives were implemented to increase student of color graduation rates such as Crew Scholars, Flight Program, and Proactive Advising. The data below was a significant factor in implementing these models and other Equity and Inclusion initiatives.
| Sex | 2015 Cohort | 2016 Cohort | 2017 Cohort | 2018 Cohort | 2019 Cohort |
| Women | 79.20% | 77.50% | 79.50% | 76.00% | 70.80% |
| Men | 76.60% | 74.80% | 78.40% | 71.00% | 77.20% |
| Race/Ethnicity | 2015 Cohort | 2016 Cohort | 2017 Cohort | 2018 Cohort | 2019 Cohort |
| White | 80.60% | 78.70% | 81.30% | 78.80% | 77.10% |
| Non-Resident | 74.10% | 72.70% | 73.30% | 50.00% | 71.40% |
| Black | 44.40% | 57.10% | 68.20% | 45.00% | 64.80% |
| Native American | n/a | 50.00% | 0.00% | n/a | n/a |
| Asian | 81.00% | 75.90% | 84.40% | 64.70% | 76.90% |
| Hispanic | 61.80% | 61.40% | 72.70% | 68.80% | 66.70% |
| Unknown | 50.00% | 100.00% | 33.30% | 0.00% | 1.00% |
| Multi | 76.00% | 75.00% | 61.50% | 66.70% | 59.30% |
Additional Numbers
Over 320 students with disabilities receive services
2018 Disabilities Services Annual Report
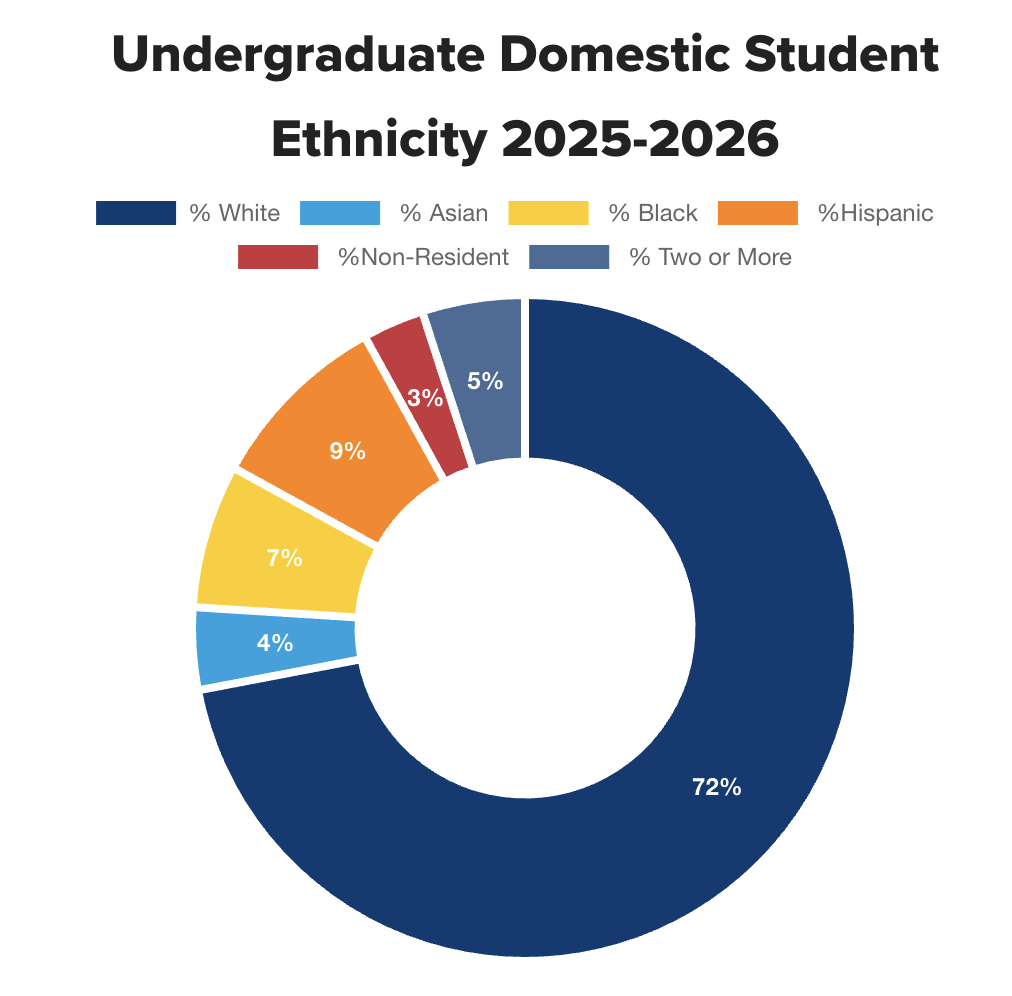
Racial/ethnic diversity in the student body has grown from 14% to 22% since 2015 and continues to increase.
The Drake Databook
19% of Drake community members identify as LGBTQ+.
2019 Drake Climate Assessment. Includes community members who identify as asexual.
Data for reports are gathered from multiple sources including Climate Survey and Office of Institutional Research and Assessment. For more information please email diversity@drake.edu.
A Commitment to Diversity